Virtualmin SQL problem
-
Hello

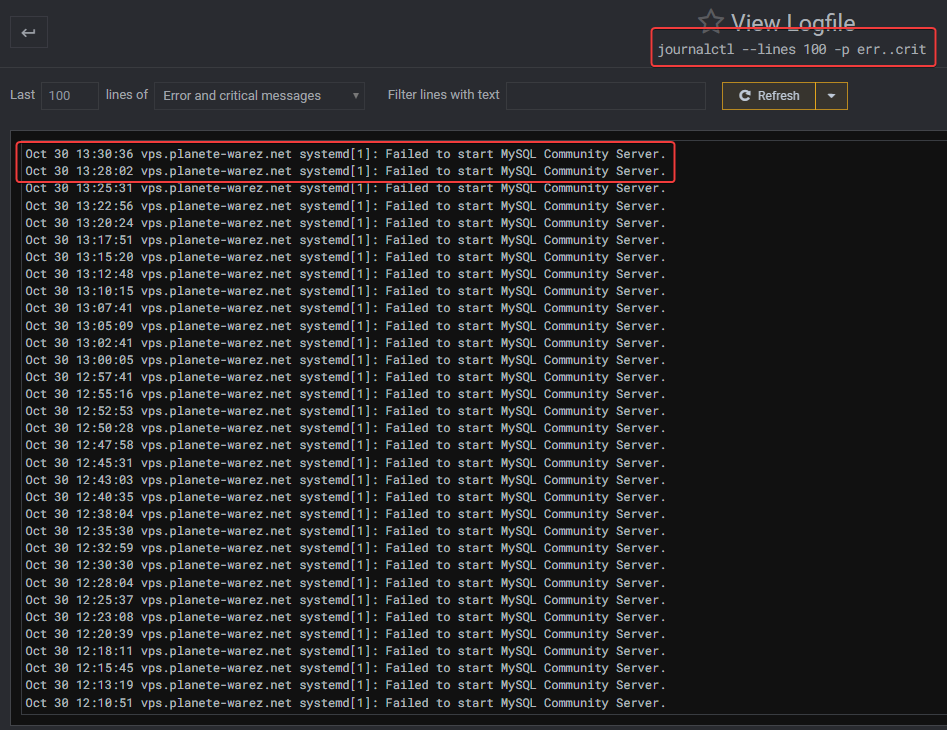
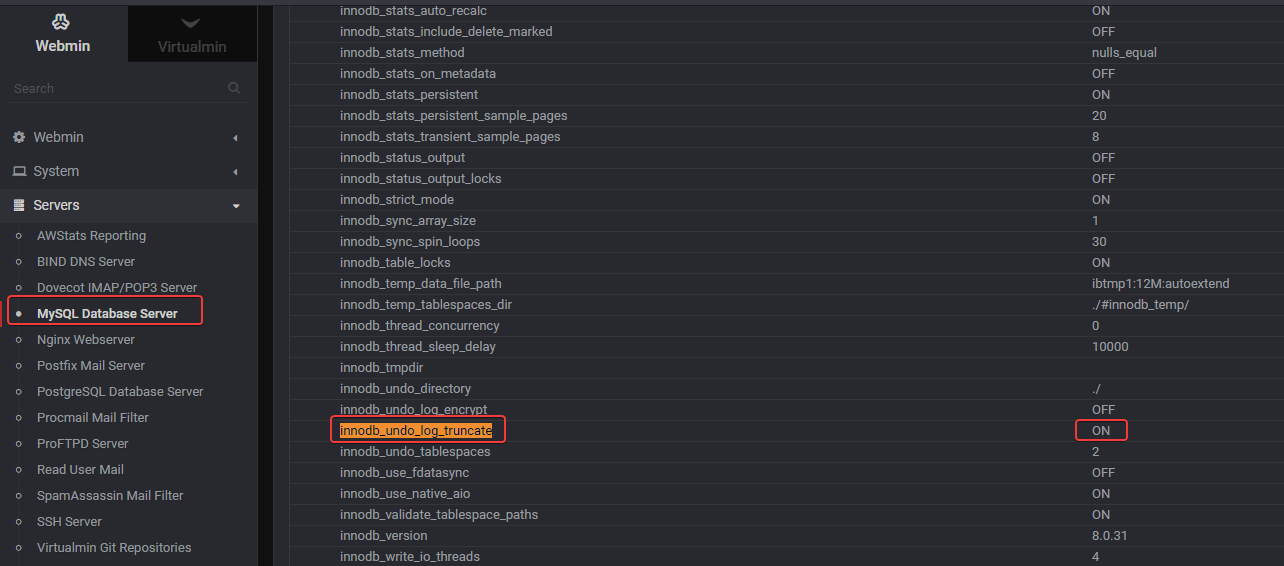
Can yo read this post and the screen at the end (mySQL variable already activate) :
https://sudonix.com/user/downpw
@DownPW can you post the output from the
mySQLconsoleSELECT NAME, SPACE_TYPE, STATE FROM INFORMATION_SCHEMA.INNODB_TABLESPACES WHERE SPACE_TYPE = 'Undo' ORDER BY NAME;I’m interested to see exactly which tables are causing this. It’s absolutely an artefact of a transaction that has not been completed. The question here is exactly what has caused this. I considered the possibility that this could be a bug in the virtualmin version you are running, although mine is the same, and I’m not experiencing this issue at all.
To be completely sure, I build another instance on my local network at home and couldn’t replicate this either.
Can you check with anyone else who has access to this server to see if any installations or upgrades have been attempted that night have failed? Understanding the origin is important at this stage in order to prevent recurrence.
The below SQL statement should produce a list of running transactions
SELECT trx.trx_id,
       trx.trx_started,
       trx.trx_mysql_thread_id
FROM INFORMATION_SCHEMA.INNODB_TRX trx
JOIN INFORMATION_SCHEMA.PROCESSLIST ps ON trx.trx_mysql_thread_id = ps.id
WHERE trx.trx_started < CURRENT_TIMESTAMP - INTERVAL 1 SECOND
  AND ps.user != 'system_user';
Finally, you should be able to identify the process itself, and kill it by using the below SQL
SELECT *
FROM performance_schema.threads
WHERE processlist_id = thread_id;
Ideally, once the rogue process has been killed, the rollback attempt should be terminated and disk space reclaimed (after a few hours)
Let me know how you get on.
You should also perhaps review this article as it will likely be very useful
-
@DownPW can you post the output from the
mySQLconsoleSELECT NAME, SPACE_TYPE, STATE FROM INFORMATION_SCHEMA.INNODB_TABLESPACES WHERE SPACE_TYPE = 'Undo' ORDER BY NAME;I’m interested to see exactly which tables are causing this. It’s absolutely an artefact of a transaction that has not been completed. The question here is exactly what has caused this. I considered the possibility that this could be a bug in the virtualmin version you are running, although mine is the same, and I’m not experiencing this issue at all.
To be completely sure, I build another instance on my local network at home and couldn’t replicate this either.
Can you check with anyone else who has access to this server to see if any installations or upgrades have been attempted that night have failed? Understanding the origin is important at this stage in order to prevent recurrence.
The below SQL statement should produce a list of running transactions
SELECT trx.trx_id, trx.trx_started, trx.trx_mysql_thread_id FROM INFORMATION_SCHEMA.INNODB_TRX trx JOIN INFORMATION_SCHEMA.PROCESSLIST ps ON trx.trx_mysql_thread_id = ps.id WHERE trx.trx_started < CURRENT_TIMESTAMP - INTERVAL 1 SECOND AND ps.user != 'system_user';Finally, you should be able to identify the process itself, and kill it by using the below SQL
SELECT * FROM performance_schema.threads WHERE processlist_id = thread_id;Ideally, once the rogue process has been killed, the rollback attempt should be terminated and disk space reclaimed (after a few hours)
Let me know how you get on.
You should also perhaps review this article as it will likely be very useful
https://stackoverflow.com/questions/62740079/mysql-undo-log-keep-growing
-
@DownPW Great. Keep me updated. Interested to know the outcome.
-
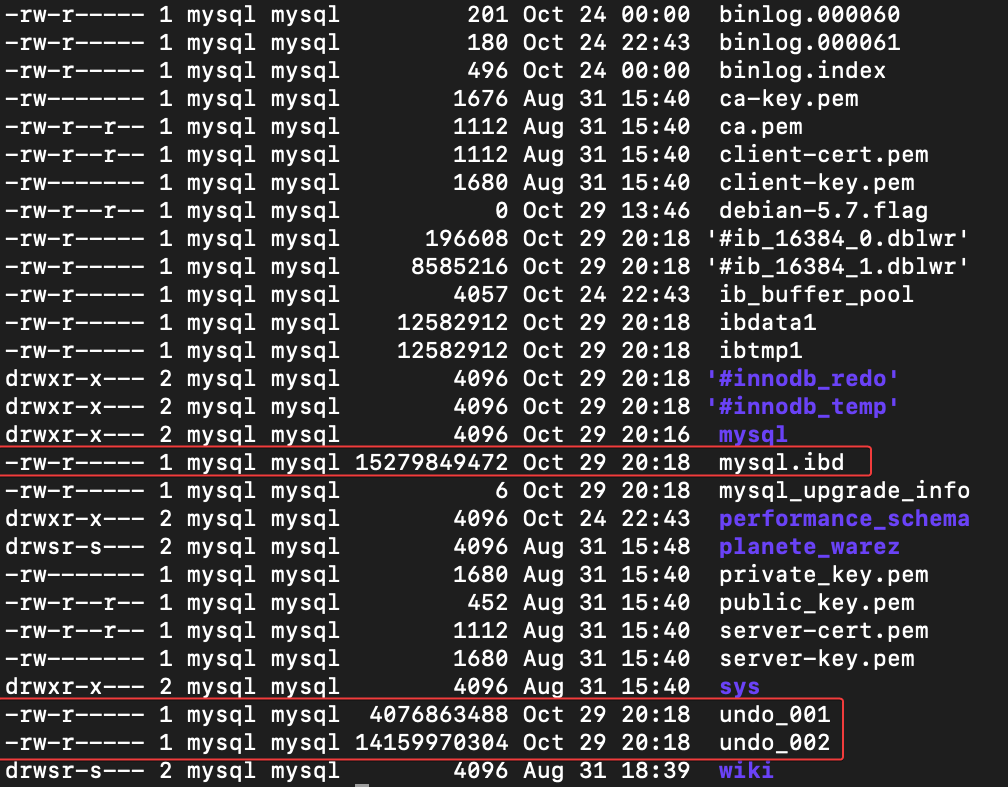
Since I manually deleted these 2 big files: undo_001 & undo_002, these 2 files have been regenerated and have not changed in size for 2 days (16Mb)
Only the mysql.ibd file (15,6 Go) is still big but it doesn’t change in size for the moment.
We have no other information to our knowledge but I see an update of kernel which was not yet done because it required a reboot at that time.
– Here is the output of :
SELECT NAME, SPACE_TYPE, STATE FROM INFORMATION_SCHEMA.INNODB_TABLESPACES WHERE SPACE_TYPE = 'Undo' ORDER BY NAME;mysql> SELECT NAME, SPACE_TYPE, STATE FROM INFORMATION_SCHEMA.INNODB_TABLESPACES WHERE SPACE_TYPE = 'Undo' ORDER BY NAME; +-----------------+------------+--------+ | NAME | SPACE_TYPE | STATE | +-----------------+------------+--------+ | innodb_undo_001 | Undo | active | | innodb_undo_002 | Undo | active | +-----------------+------------+--------+ 2 rows in set (0.05 sec) – Here is the output of :
SELECT trx.trx_id, trx.trx_started, trx.trx_mysql_thread_id FROM INFORMATION_SCHEMA.INNODB_TRX trx JOIN INFORMATION_SCHEMA.PROCESSLIST ps ON trx.trx_mysql_thread_id = ps.id WHERE trx.trx_started < CURRENT_TIMESTAMP - INTERVAL 1 SECOND AND ps.user != 'system_user'; I don’t know if I write it correctly in SQL console ?
mysql> SELECT trx.trx_id,
    ->        trx.trx_started,
    ->        trx.trx_mysql_thread_id
    -> FROM INFORMATION_SCHEMA.INNODB_TRX trx
    -> JOIN INFORMATION_SCHEMA.PROCESSLIST ps ON trx.trx_mysql_thread_id = ps.id
    -> WHERE trx.trx_started < CURRENT_TIMESTAMP - INTERVAL 1 SECOND
    ->   AND ps.user != 'system_user';
Empty set (0.00 sec)
Well that doesn’t tell me why the mysql.ibd file is 15.6 GB

-
Since I manually deleted these 2 big files: undo_001 & undo_002, these 2 files have been regenerated and have not changed in size for 2 days (16Mb)
Only the mysql.ibd file (15,6 Go) is still big but it doesn’t change in size for the moment.
We have no other information to our knowledge but I see an update of kernel which was not yet done because it required a reboot at that time.
– Here is the output of :
SELECT NAME, SPACE_TYPE, STATE FROM INFORMATION_SCHEMA.INNODB_TABLESPACES WHERE SPACE_TYPE = 'Undo' ORDER BY NAME;mysql> SELECT NAME, SPACE_TYPE, STATE FROM INFORMATION_SCHEMA.INNODB_TABLESPACES WHERE SPACE_TYPE = 'Undo' ORDER BY NAME; +-----------------+------------+--------+ | NAME | SPACE_TYPE | STATE | +-----------------+------------+--------+ | innodb_undo_001 | Undo | active | | innodb_undo_002 | Undo | active | +-----------------+------------+--------+ 2 rows in set (0.05 sec)– Here is the output of :
SELECT trx.trx_id, trx.trx_started, trx.trx_mysql_thread_id FROM INFORMATION_SCHEMA.INNODB_TRX trx JOIN INFORMATION_SCHEMA.PROCESSLIST ps ON trx.trx_mysql_thread_id = ps.id WHERE trx.trx_started < CURRENT_TIMESTAMP - INTERVAL 1 SECOND AND ps.user != 'system_user';I don’t know if I write it correctly in SQL console ?
mysql> SELECT trx.trx_id, -> trx.trx_started, -> trx.trx_mysql_thread_id -> FROM INFORMATION_SCHEMA.INNODB_TRX trx -> JOIN INFORMATION_SCHEMA.PROCESSLIST ps ON trx.trx_mysql_thread_id = ps.id -> WHERE trx.trx_started < CURRENT_TIMESTAMP - INTERVAL 1 SECOND -> AND ps.user != 'system_user'; Empty set (0.00 sec)Well that doesn’t tell me why the mysql.ibd file is 15.6 GB

Here is the result of another mySQL query to see the size of all my databases
but it gave the following result :mysql> SELECT table_schema AS "Database", -> ROUND(SUM(data_length + index_length) / 1024 / 1024, 2) AS "Size (MB)" -> FROM information_schema.TABLES -> GROUP BY table_schema; +--------------------+-----------+ | Database | Size (MB) | +--------------------+-----------+ | information_schema | 0.00 | | mysql | 2.59 | | performance_schema | 0.00 | | sys | 0.02 | +--------------------+-----------+ 4 rows in set (0.41 sec) –> None of these results come close to the size of the mysql.ibd file.
BTW following is the result of other query i found for check the unused space of tablespace :
mysql> select table_name, SUM(data_length+index_length), MAX(data_free)
    -> from information_schema.tables
    -> where table_schema='mysql'
    -> group by table_name
    -> with rollup;
+------------------------------------------------------+-------------------------------+----------------+
| TABLE_NAME                                           | SUM(data_length+index_length) | MAX(data_free) |
+------------------------------------------------------+-------------------------------+----------------+
| columns_priv                                         |                         16384 |    16326328320 |
| component                                            |                         16384 |    16326328320 |
| db                                                   |                         32768 |    16326328320 |
| default_roles                                        |                         16384 |    16326328320 |
| engine_cost                                          |                         16384 |    16326328320 |
| func                                                 |                         16384 |    16326328320 |
| general_log                                          |                             0 |              0 |
| global_grants                                        |                         49152 |    16326328320 |
| gtid_executed                                        |                         16384 |    16326328320 |
| help_category                                        |                         32768 |    16326328320 |
| help_keyword                                         |                        262144 |    16326328320 |
| help_relation                                        |                         98304 |    16326328320 |
| help_topic                                           |                       1687552 |    16326328320 |
| innodb_index_stats                                   |                         16384 |    16326328320 |
| innodb_table_stats                                   |                         16384 |    16326328320 |
| password_history                                     |                         16384 |    16326328320 |
| plugin                                               |                         16384 |    16326328320 |
| procs_priv                                           |                         32768 |    16326328320 |
| proxies_priv                                         |                         32768 |    16326328320 |
| replication_asynchronous_connection_failover         |                         32768 |    16326328320 |
| replication_asynchronous_connection_failover_managed |                         16384 |    16326328320 |
| replication_group_configuration_version              |                         16384 |    16326328320 |
| replication_group_member_actions                     |                         32768 |    16326328320 |
| role_edges                                           |                         16384 |    16326328320 |
| server_cost                                          |                         16384 |    16326328320 |
| servers                                              |                         16384 |    16326328320 |
| slave_master_info                                    |                         16384 |    16326328320 |
| slave_relay_log_info                                 |                         16384 |    16326328320 |
| slave_worker_info                                    |                         16384 |    16326328320 |
| slow_log                                             |                             0 |              0 |
| tables_priv                                          |                         32768 |    16326328320 |
| time_zone                                            |                         16384 |    16326328320 |
| time_zone_leap_second                                |                         16384 |    16326328320 |
| time_zone_name                                       |                         16384 |    16326328320 |
| time_zone_transition                                 |                         16384 |    16326328320 |
| time_zone_transition_type                            |                         16384 |    16326328320 |
| user                                                 |                         16384 |    16326328320 |
| NULL                                                 |                       2719744 |    16326328320 |
+------------------------------------------------------+-------------------------------+----------------+
38 rows in set (0.00 sec)
Another Query for search transation, I don’t see any lock transaction on database :
part of the result :
------------
TRANSACTIONS
------------
Trx id counter 11707713
Purge done for trx's n:o < 11707713 undo n:o < 0 state: running but idle
History list length 0
LIST OF TRANSACTIONS FOR EACH SESSION:
---TRANSACTION 421688359443672, not started
0 lock struct(s), heap size 1128, 0 row lock(s)
---TRANSACTION 421688359442864, not started
0 lock struct(s), heap size 1128, 0 row lock(s)
---TRANSACTION 421688359442056, not started
0 lock struct(s), heap size 1128, 0 row lock(s)
All the result :
show engine innodb status\G *************************** 1. row *************************** Type: InnoDB Name: Status: ===================================== 2022-11-07 21:13:43 140213236291328 INNODB MONITOR OUTPUT ===================================== Per second averages calculated from the last 35 seconds ----------------- BACKGROUND THREAD ----------------- srv_master_thread loops: 31 srv_active, 0 srv_shutdown, 257609 srv_idle srv_master_thread log flush and writes: 0 ---------- SEMAPHORES ---------- OS WAIT ARRAY INFO: reservation count 24 OS WAIT ARRAY INFO: signal count 21 RW-shared spins 0, rounds 0, OS waits 0 RW-excl spins 0, rounds 0, OS waits 0 RW-sx spins 0, rounds 0, OS waits 0 Spin rounds per wait: 0.00 RW-shared, 0.00 RW-excl, 0.00 RW-sx ------------ TRANSACTIONS ------------ Trx id counter 11707713 Purge done for trx's n:o < 11707713 undo n:o < 0 state: running but idle History list length 0 LIST OF TRANSACTIONS FOR EACH SESSION: ---TRANSACTION 421688359443672, not started 0 lock struct(s), heap size 1128, 0 row lock(s) ---TRANSACTION 421688359442864, not started 0 lock struct(s), heap size 1128, 0 row lock(s) ---TRANSACTION 421688359442056, not started 0 lock struct(s), heap size 1128, 0 row lock(s) -------- FILE I/O -------- I/O thread 0 state: waiting for completed aio requests (insert buffer thread) I/O thread 1 state: waiting for completed aio requests (log thread) I/O thread 2 state: waiting for completed aio requests (read thread) I/O thread 3 state: waiting for completed aio requests (read thread) I/O thread 4 state: waiting for completed aio requests (read thread) I/O thread 5 state: waiting for completed aio requests (read thread) I/O thread 6 state: waiting for completed aio requests (write thread) I/O thread 7 state: waiting for completed aio requests (write thread) I/O thread 8 state: waiting for completed aio requests (write thread) I/O thread 9 state: waiting for completed aio requests (write thread) Pending normal aio reads: [0, 0, 0, 0] , aio writes: [0, 0, 0, 0] , ibuf aio reads:, log i/o's: Pending flushes (fsync) log: 0; buffer pool: 0 472 OS file reads, 2095 OS file writes, 963 OS fsyncs 0.00 reads/s, 0 avg bytes/read, 0.00 writes/s, 0.00 fsyncs/s ------------------------------------- INSERT BUFFER AND ADAPTIVE HASH INDEX ------------------------------------- Ibuf: size 1, free list len 0, seg size 2, 0 merges merged operations: insert 0, delete mark 0, delete 0 discarded operations: insert 0, delete mark 0, delete 0 Hash table size 34679, node heap has 2 buffer(s) Hash table size 34679, node heap has 0 buffer(s) Hash table size 34679, node heap has 7 buffer(s) Hash table size 34679, node heap has 2 buffer(s) Hash table size 34679, node heap has 2 buffer(s) Hash table size 34679, node heap has 0 buffer(s) Hash table size 34679, node heap has 2 buffer(s) Hash table size 34679, node heap has 1 buffer(s) 0.00 hash searches/s, 0.00 non-hash searches/s --- LOG --- Log sequence number 72770518572 Log buffer assigned up to 72770518572 Log buffer completed up to 72770518572 Log written up to 72770518572 Log flushed up to 72770518572 Added dirty pages up to 72770518572 Pages flushed up to 72770518572 Last checkpoint at 72770518572 Log minimum file id is 22221 Log maximum file id is 22221 694 log i/o's done, 0.00 log i/o's/second ---------------------- BUFFER POOL AND MEMORY ---------------------- Total large memory allocated 0 Dictionary memory allocated 582286 Buffer pool size 8192 Free buffers 7161 Database pages 1015 Old database pages 354 Modified db pages 0 Pending reads 0 Pending writes: LRU 0, flush list 0, single page 0 Pages made young 750, not young 5674 0.00 youngs/s, 0.00 non-youngs/s Pages read 450, created 565, written 1087 0.00 reads/s, 0.00 creates/s, 0.00 writes/s No buffer pool page gets since the last printout Pages read ahead 0.00/s, evicted without access 0.00/s, Random read ahead 0.00/s LRU len: 1015, unzip_LRU len: 0 I/O sum[0]:cur[0], unzip sum[0]:cur[0] -------------- ROW OPERATIONS -------------- 0 queries inside InnoDB, 0 queries in queue 0 read views open inside InnoDB Process ID=679488, Main thread ID=140212411815680 , state=sleeping Number of rows inserted 0, updated 0, deleted 0, read 0 0.00 inserts/s, 0.00 updates/s, 0.00 deletes/s, 0.00 reads/s Number of system rows inserted 46, updated 459, deleted 8, read 37463 0.00 inserts/s, 0.00 updates/s, 0.00 deletes/s, 0.00 reads/s ---------------------------- END OF INNODB MONITOR OUTPUT ============================ 1 row in set (0.01 sec) -
Here is the result of another mySQL query to see the size of all my databases
but it gave the following result :mysql> SELECT table_schema AS "Database", -> ROUND(SUM(data_length + index_length) / 1024 / 1024, 2) AS "Size (MB)" -> FROM information_schema.TABLES -> GROUP BY table_schema; +--------------------+-----------+ | Database | Size (MB) | +--------------------+-----------+ | information_schema | 0.00 | | mysql | 2.59 | | performance_schema | 0.00 | | sys | 0.02 | +--------------------+-----------+ 4 rows in set (0.41 sec)–> None of these results come close to the size of the mysql.ibd file.
BTW following is the result of other query i found for check the unused space of tablespace :
mysql> select table_name, SUM(data_length+index_length), MAX(data_free)
    -> from information_schema.tables
    -> where table_schema='mysql'
    -> group by table_name
    -> with rollup;
+------------------------------------------------------+-------------------------------+----------------+
| TABLE_NAME                                           | SUM(data_length+index_length) | MAX(data_free) |
+------------------------------------------------------+-------------------------------+----------------+
| columns_priv                                         |                         16384 |    16326328320 |
| component                                            |                         16384 |    16326328320 |
| db                                                   |                         32768 |    16326328320 |
| default_roles                                        |                         16384 |    16326328320 |
| engine_cost                                          |                         16384 |    16326328320 |
| func                                                 |                         16384 |    16326328320 |
| general_log                                          |                             0 |              0 |
| global_grants                                        |                         49152 |    16326328320 |
| gtid_executed                                        |                         16384 |    16326328320 |
| help_category                                        |                         32768 |    16326328320 |
| help_keyword                                         |                        262144 |    16326328320 |
| help_relation                                        |                         98304 |    16326328320 |
| help_topic                                           |                       1687552 |    16326328320 |
| innodb_index_stats                                   |                         16384 |    16326328320 |
| innodb_table_stats                                   |                         16384 |    16326328320 |
| password_history                                     |                         16384 |    16326328320 |
| plugin                                               |                         16384 |    16326328320 |
| procs_priv                                           |                         32768 |    16326328320 |
| proxies_priv                                         |                         32768 |    16326328320 |
| replication_asynchronous_connection_failover         |                         32768 |    16326328320 |
| replication_asynchronous_connection_failover_managed |                         16384 |    16326328320 |
| replication_group_configuration_version              |                         16384 |    16326328320 |
| replication_group_member_actions                     |                         32768 |    16326328320 |
| role_edges                                           |                         16384 |    16326328320 |
| server_cost                                          |                         16384 |    16326328320 |
| servers                                              |                         16384 |    16326328320 |
| slave_master_info                                    |                         16384 |    16326328320 |
| slave_relay_log_info                                 |                         16384 |    16326328320 |
| slave_worker_info                                    |                         16384 |    16326328320 |
| slow_log                                             |                             0 |              0 |
| tables_priv                                          |                         32768 |    16326328320 |
| time_zone                                            |                         16384 |    16326328320 |
| time_zone_leap_second                                |                         16384 |    16326328320 |
| time_zone_name                                       |                         16384 |    16326328320 |
| time_zone_transition                                 |                         16384 |    16326328320 |
| time_zone_transition_type                            |                         16384 |    16326328320 |
| user                                                 |                         16384 |    16326328320 |
| NULL                                                 |                       2719744 |    16326328320 |
+------------------------------------------------------+-------------------------------+----------------+
38 rows in set (0.00 sec)
Another Query for search transation, I don’t see any lock transaction on database :
part of the result :
------------
TRANSACTIONS
------------
Trx id counter 11707713
Purge done for trx's n:o < 11707713 undo n:o < 0 state: running but idle
History list length 0
LIST OF TRANSACTIONS FOR EACH SESSION:
---TRANSACTION 421688359443672, not started
0 lock struct(s), heap size 1128, 0 row lock(s)
---TRANSACTION 421688359442864, not started
0 lock struct(s), heap size 1128, 0 row lock(s)
---TRANSACTION 421688359442056, not started
0 lock struct(s), heap size 1128, 0 row lock(s)
All the result :
show engine innodb status\G *************************** 1. row *************************** Type: InnoDB Name: Status: ===================================== 2022-11-07 21:13:43 140213236291328 INNODB MONITOR OUTPUT ===================================== Per second averages calculated from the last 35 seconds ----------------- BACKGROUND THREAD ----------------- srv_master_thread loops: 31 srv_active, 0 srv_shutdown, 257609 srv_idle srv_master_thread log flush and writes: 0 ---------- SEMAPHORES ---------- OS WAIT ARRAY INFO: reservation count 24 OS WAIT ARRAY INFO: signal count 21 RW-shared spins 0, rounds 0, OS waits 0 RW-excl spins 0, rounds 0, OS waits 0 RW-sx spins 0, rounds 0, OS waits 0 Spin rounds per wait: 0.00 RW-shared, 0.00 RW-excl, 0.00 RW-sx ------------ TRANSACTIONS ------------ Trx id counter 11707713 Purge done for trx's n:o < 11707713 undo n:o < 0 state: running but idle History list length 0 LIST OF TRANSACTIONS FOR EACH SESSION: ---TRANSACTION 421688359443672, not started 0 lock struct(s), heap size 1128, 0 row lock(s) ---TRANSACTION 421688359442864, not started 0 lock struct(s), heap size 1128, 0 row lock(s) ---TRANSACTION 421688359442056, not started 0 lock struct(s), heap size 1128, 0 row lock(s) -------- FILE I/O -------- I/O thread 0 state: waiting for completed aio requests (insert buffer thread) I/O thread 1 state: waiting for completed aio requests (log thread) I/O thread 2 state: waiting for completed aio requests (read thread) I/O thread 3 state: waiting for completed aio requests (read thread) I/O thread 4 state: waiting for completed aio requests (read thread) I/O thread 5 state: waiting for completed aio requests (read thread) I/O thread 6 state: waiting for completed aio requests (write thread) I/O thread 7 state: waiting for completed aio requests (write thread) I/O thread 8 state: waiting for completed aio requests (write thread) I/O thread 9 state: waiting for completed aio requests (write thread) Pending normal aio reads: [0, 0, 0, 0] , aio writes: [0, 0, 0, 0] , ibuf aio reads:, log i/o's: Pending flushes (fsync) log: 0; buffer pool: 0 472 OS file reads, 2095 OS file writes, 963 OS fsyncs 0.00 reads/s, 0 avg bytes/read, 0.00 writes/s, 0.00 fsyncs/s ------------------------------------- INSERT BUFFER AND ADAPTIVE HASH INDEX ------------------------------------- Ibuf: size 1, free list len 0, seg size 2, 0 merges merged operations: insert 0, delete mark 0, delete 0 discarded operations: insert 0, delete mark 0, delete 0 Hash table size 34679, node heap has 2 buffer(s) Hash table size 34679, node heap has 0 buffer(s) Hash table size 34679, node heap has 7 buffer(s) Hash table size 34679, node heap has 2 buffer(s) Hash table size 34679, node heap has 2 buffer(s) Hash table size 34679, node heap has 0 buffer(s) Hash table size 34679, node heap has 2 buffer(s) Hash table size 34679, node heap has 1 buffer(s) 0.00 hash searches/s, 0.00 non-hash searches/s --- LOG --- Log sequence number 72770518572 Log buffer assigned up to 72770518572 Log buffer completed up to 72770518572 Log written up to 72770518572 Log flushed up to 72770518572 Added dirty pages up to 72770518572 Pages flushed up to 72770518572 Last checkpoint at 72770518572 Log minimum file id is 22221 Log maximum file id is 22221 694 log i/o's done, 0.00 log i/o's/second ---------------------- BUFFER POOL AND MEMORY ---------------------- Total large memory allocated 0 Dictionary memory allocated 582286 Buffer pool size 8192 Free buffers 7161 Database pages 1015 Old database pages 354 Modified db pages 0 Pending reads 0 Pending writes: LRU 0, flush list 0, single page 0 Pages made young 750, not young 5674 0.00 youngs/s, 0.00 non-youngs/s Pages read 450, created 565, written 1087 0.00 reads/s, 0.00 creates/s, 0.00 writes/s No buffer pool page gets since the last printout Pages read ahead 0.00/s, evicted without access 0.00/s, Random read ahead 0.00/s LRU len: 1015, unzip_LRU len: 0 I/O sum[0]:cur[0], unzip sum[0]:cur[0] -------------- ROW OPERATIONS -------------- 0 queries inside InnoDB, 0 queries in queue 0 read views open inside InnoDB Process ID=679488, Main thread ID=140212411815680 , state=sleeping Number of rows inserted 0, updated 0, deleted 0, read 0 0.00 inserts/s, 0.00 updates/s, 0.00 deletes/s, 0.00 reads/s Number of system rows inserted 46, updated 459, deleted 8, read 37463 0.00 inserts/s, 0.00 updates/s, 0.00 deletes/s, 0.00 reads/s ---------------------------- END OF INNODB MONITOR OUTPUT ============================ 1 row in set (0.01 sec)@DownPW thanks for this. Let me review and I’ll get back to you.
-
Here is the result of another mySQL query to see the size of all my databases
but it gave the following result :mysql> SELECT table_schema AS "Database", -> ROUND(SUM(data_length + index_length) / 1024 / 1024, 2) AS "Size (MB)" -> FROM information_schema.TABLES -> GROUP BY table_schema; +--------------------+-----------+ | Database | Size (MB) | +--------------------+-----------+ | information_schema | 0.00 | | mysql | 2.59 | | performance_schema | 0.00 | | sys | 0.02 | +--------------------+-----------+ 4 rows in set (0.41 sec)–> None of these results come close to the size of the mysql.ibd file.
BTW following is the result of other query i found for check the unused space of tablespace :
mysql> select table_name, SUM(data_length+index_length), MAX(data_free) -> from information_schema.tables -> where table_schema='mysql' -> group by table_name -> with rollup; +------------------------------------------------------+-------------------------------+----------------+ | TABLE_NAME | SUM(data_length+index_length) | MAX(data_free) | +------------------------------------------------------+-------------------------------+----------------+ | columns_priv | 16384 | 16326328320 | | component | 16384 | 16326328320 | | db | 32768 | 16326328320 | | default_roles | 16384 | 16326328320 | | engine_cost | 16384 | 16326328320 | | func | 16384 | 16326328320 | | general_log | 0 | 0 | | global_grants | 49152 | 16326328320 | | gtid_executed | 16384 | 16326328320 | | help_category | 32768 | 16326328320 | | help_keyword | 262144 | 16326328320 | | help_relation | 98304 | 16326328320 | | help_topic | 1687552 | 16326328320 | | innodb_index_stats | 16384 | 16326328320 | | innodb_table_stats | 16384 | 16326328320 | | password_history | 16384 | 16326328320 | | plugin | 16384 | 16326328320 | | procs_priv | 32768 | 16326328320 | | proxies_priv | 32768 | 16326328320 | | replication_asynchronous_connection_failover | 32768 | 16326328320 | | replication_asynchronous_connection_failover_managed | 16384 | 16326328320 | | replication_group_configuration_version | 16384 | 16326328320 | | replication_group_member_actions | 32768 | 16326328320 | | role_edges | 16384 | 16326328320 | | server_cost | 16384 | 16326328320 | | servers | 16384 | 16326328320 | | slave_master_info | 16384 | 16326328320 | | slave_relay_log_info | 16384 | 16326328320 | | slave_worker_info | 16384 | 16326328320 | | slow_log | 0 | 0 | | tables_priv | 32768 | 16326328320 | | time_zone | 16384 | 16326328320 | | time_zone_leap_second | 16384 | 16326328320 | | time_zone_name | 16384 | 16326328320 | | time_zone_transition | 16384 | 16326328320 | | time_zone_transition_type | 16384 | 16326328320 | | user | 16384 | 16326328320 | | NULL | 2719744 | 16326328320 | +------------------------------------------------------+-------------------------------+----------------+ 38 rows in set (0.00 sec)Another Query for search transation, I don’t see any lock transaction on database :
part of the result :
------------ TRANSACTIONS ------------ Trx id counter 11707713 Purge done for trx's n:o < 11707713 undo n:o < 0 state: running but idle History list length 0 LIST OF TRANSACTIONS FOR EACH SESSION: ---TRANSACTION 421688359443672, not started 0 lock struct(s), heap size 1128, 0 row lock(s) ---TRANSACTION 421688359442864, not started 0 lock struct(s), heap size 1128, 0 row lock(s) ---TRANSACTION 421688359442056, not started 0 lock struct(s), heap size 1128, 0 row lock(s)All the result :
show engine innodb status\G *************************** 1. row *************************** Type: InnoDB Name: Status: ===================================== 2022-11-07 21:13:43 140213236291328 INNODB MONITOR OUTPUT ===================================== Per second averages calculated from the last 35 seconds ----------------- BACKGROUND THREAD ----------------- srv_master_thread loops: 31 srv_active, 0 srv_shutdown, 257609 srv_idle srv_master_thread log flush and writes: 0 ---------- SEMAPHORES ---------- OS WAIT ARRAY INFO: reservation count 24 OS WAIT ARRAY INFO: signal count 21 RW-shared spins 0, rounds 0, OS waits 0 RW-excl spins 0, rounds 0, OS waits 0 RW-sx spins 0, rounds 0, OS waits 0 Spin rounds per wait: 0.00 RW-shared, 0.00 RW-excl, 0.00 RW-sx ------------ TRANSACTIONS ------------ Trx id counter 11707713 Purge done for trx's n:o < 11707713 undo n:o < 0 state: running but idle History list length 0 LIST OF TRANSACTIONS FOR EACH SESSION: ---TRANSACTION 421688359443672, not started 0 lock struct(s), heap size 1128, 0 row lock(s) ---TRANSACTION 421688359442864, not started 0 lock struct(s), heap size 1128, 0 row lock(s) ---TRANSACTION 421688359442056, not started 0 lock struct(s), heap size 1128, 0 row lock(s) -------- FILE I/O -------- I/O thread 0 state: waiting for completed aio requests (insert buffer thread) I/O thread 1 state: waiting for completed aio requests (log thread) I/O thread 2 state: waiting for completed aio requests (read thread) I/O thread 3 state: waiting for completed aio requests (read thread) I/O thread 4 state: waiting for completed aio requests (read thread) I/O thread 5 state: waiting for completed aio requests (read thread) I/O thread 6 state: waiting for completed aio requests (write thread) I/O thread 7 state: waiting for completed aio requests (write thread) I/O thread 8 state: waiting for completed aio requests (write thread) I/O thread 9 state: waiting for completed aio requests (write thread) Pending normal aio reads: [0, 0, 0, 0] , aio writes: [0, 0, 0, 0] , ibuf aio reads:, log i/o's: Pending flushes (fsync) log: 0; buffer pool: 0 472 OS file reads, 2095 OS file writes, 963 OS fsyncs 0.00 reads/s, 0 avg bytes/read, 0.00 writes/s, 0.00 fsyncs/s ------------------------------------- INSERT BUFFER AND ADAPTIVE HASH INDEX ------------------------------------- Ibuf: size 1, free list len 0, seg size 2, 0 merges merged operations: insert 0, delete mark 0, delete 0 discarded operations: insert 0, delete mark 0, delete 0 Hash table size 34679, node heap has 2 buffer(s) Hash table size 34679, node heap has 0 buffer(s) Hash table size 34679, node heap has 7 buffer(s) Hash table size 34679, node heap has 2 buffer(s) Hash table size 34679, node heap has 2 buffer(s) Hash table size 34679, node heap has 0 buffer(s) Hash table size 34679, node heap has 2 buffer(s) Hash table size 34679, node heap has 1 buffer(s) 0.00 hash searches/s, 0.00 non-hash searches/s --- LOG --- Log sequence number 72770518572 Log buffer assigned up to 72770518572 Log buffer completed up to 72770518572 Log written up to 72770518572 Log flushed up to 72770518572 Added dirty pages up to 72770518572 Pages flushed up to 72770518572 Last checkpoint at 72770518572 Log minimum file id is 22221 Log maximum file id is 22221 694 log i/o's done, 0.00 log i/o's/second ---------------------- BUFFER POOL AND MEMORY ---------------------- Total large memory allocated 0 Dictionary memory allocated 582286 Buffer pool size 8192 Free buffers 7161 Database pages 1015 Old database pages 354 Modified db pages 0 Pending reads 0 Pending writes: LRU 0, flush list 0, single page 0 Pages made young 750, not young 5674 0.00 youngs/s, 0.00 non-youngs/s Pages read 450, created 565, written 1087 0.00 reads/s, 0.00 creates/s, 0.00 writes/s No buffer pool page gets since the last printout Pages read ahead 0.00/s, evicted without access 0.00/s, Random read ahead 0.00/s LRU len: 1015, unzip_LRU len: 0 I/O sum[0]:cur[0], unzip sum[0]:cur[0] -------------- ROW OPERATIONS -------------- 0 queries inside InnoDB, 0 queries in queue 0 read views open inside InnoDB Process ID=679488, Main thread ID=140212411815680 , state=sleeping Number of rows inserted 0, updated 0, deleted 0, read 0 0.00 inserts/s, 0.00 updates/s, 0.00 deletes/s, 0.00 reads/s Number of system rows inserted 46, updated 459, deleted 8, read 37463 0.00 inserts/s, 0.00 updates/s, 0.00 deletes/s, 0.00 reads/s ---------------------------- END OF INNODB MONITOR OUTPUT ============================ 1 row in set (0.01 sec)@DownPW on checking, it seems that
*.idbfiles by default never shrink - only grow. However, it should be possible to reclaim the disk space viaoptimize table <db.tablename>. I also found this -
@DownPW on checking, it seems that
*.idbfiles by default never shrink - only grow. However, it should be possible to reclaim the disk space viaoptimize table <db.tablename>. I also found this@phenomlab said in Virtualmin SQL problem:
optimize table <db.tablename>.
Ok for test this
optimize table <db.tablename>but I hope it’s not dangerous… And what <db.tablename> put in this case ?
Exemple
optimize table XXXX.XXX -
@phenomlab said in Virtualmin SQL problem:
optimize table <db.tablename>.
Ok for test this
optimize table <db.tablename>but I hope it’s not dangerous… And what <db.tablename> put in this case ?
Exemple
optimize table XXXX.XXX@DownPW it’s perfectly safe. However, the hard part is identifying the actual table causing the bloat.
-
@phenomlab said in Virtualmin SQL problem:
optimize table <db.tablename>.
Ok for test this
optimize table <db.tablename>but I hope it’s not dangerous… And what <db.tablename> put in this case ?
Exemple
optimize table XXXX.XXX@DownPW this is an interesting read
It seems that this is potentially a bug in some circumstances, but it’s the first thing I’ve come across it Out of curiosity, what do you use MySQL for, if at all ?
One other option would be to use
phpMyAdminwhich has a decent GUI interface to perform the analysis and hopefully resolve the issue. Not only will it allow you to locate the offending table, but run maintenance against it to hopefully shrink it. -
@DownPW this is an interesting read
https://bugs.mysql.com/bug.php?id=96466
It seems that this is potentially a bug in some circumstances, but it’s the first thing I’ve come across it Out of curiosity, what do you use MySQL for, if at all ?
One other option would be to use
phpMyAdminwhich has a decent GUI interface to perform the analysis and hopefully resolve the issue. Not only will it allow you to locate the offending table, but run maintenance against it to hopefully shrink it.@phenomlab said in Virtualmin SQL problem:
what do you use MySQL for, if at all ?
That’s the problem, I don’t use mySQL for anything at all.
The only database management systems I use are mongoDB for NodeBB and postgreSQL for wiki.js.
I think MySQL was installed when you have installing Virtualmin/Webmin on the server.
Anyway I thought it was. Anyway I thought it was. If not, I can simply uninstall mySQL and delete files
-
@phenomlab said in Virtualmin SQL problem:
what do you use MySQL for, if at all ?
That’s the problem, I don’t use mySQL for anything at all.
The only database management systems I use are mongoDB for NodeBB and postgreSQL for wiki.js.
I think MySQL was installed when you have installing Virtualmin/Webmin on the server.
Anyway I thought it was. Anyway I thought it was. If not, I can simply uninstall mySQL and delete files
@DownPW you’ll need to go though the virtualmin way of removing the module itself, which is essentially the same as an
apt remove mysql-serverbut with added dependency removal.Up to you at this point. I can have a look at resolving (hopefully) this tomorrow, or you can proceed with the removal?
Let me know.
-
@DownPW you’ll need to go though the virtualmin way of removing the module itself, which is essentially the same as an
apt remove mysql-serverbut with added dependency removal.Up to you at this point. I can have a look at resolving (hopefully) this tomorrow, or you can proceed with the removal?
Let me know.
I have delete the webmin modules like this :
But it wasn’t enough because the mySQL service was still present.
So I have uninstall completely mysql like this:- First make sure that MySQL service is stopped :
sudo systemctl stop mysql- Remove MySQL related all packages completely :
sudo apt-get purge mysql-server mysql-client mysql-common mysql-server-core-* mysql-client-core-*- Remove MySQL configuration and data :
sudo rm -rf /etc/mysql /var/lib/mysql /var/log/mysql- (Optional) Remove unnecessary packages.
sudo apt autoremove- (Optional) Remove apt cache.
sudo apt autocleanNo issues noted so far
Finally problem solved simply but I still don’t understand why this service was installed.
I thought Webmin or Virtualmin was using it when it’s not at all after confirming this by @phenomlab
Thanks dude. Always
-
undefined DownPW has marked this topic as solved on 12 Nov 2022, 12:58
-
I have delete the webmin modules like this :
But it wasn’t enough because the mySQL service was still present.
So I have uninstall completely mysql like this:- First make sure that MySQL service is stopped :
sudo systemctl stop mysql- Remove MySQL related all packages completely :
sudo apt-get purge mysql-server mysql-client mysql-common mysql-server-core-* mysql-client-core-*- Remove MySQL configuration and data :
sudo rm -rf /etc/mysql /var/lib/mysql /var/log/mysql- (Optional) Remove unnecessary packages.
sudo apt autoremove- (Optional) Remove apt cache.
sudo apt autocleanNo issues noted so far
Finally problem solved simply but I still don’t understand why this service was installed.
I thought Webmin or Virtualmin was using it when it’s not at all after confirming this by @phenomlab
Thanks dude. Always
@DownPW said in Virtualmin SQL problem:
Finally problem solved simply but I still don’t understand why this service was installed.
Glad to hear (and see) that this issue is now resolved. Virtualmin and Webmin are both derived from the origin of LAMP (Linux, Apache, MySQL, and PHP) - the earliest form would have been a project which was a fork of the original concept called “WAMP” (Windows, Apache, MySQL, and PHP)
Scroll to the bottom, and you’ll see the packages it comes with
Over time, activity on this project dropped somewhat due to the rise of Virtualmin and Webmin - acting as “full blown” platforms designed to manage an entire web server from start to finish, and providing an easy way to do so with a GUI interface. Over time, the LAMP bundle became LEMP (Linux, NGINX [actually pronounced “engine X”], MySQL, and PHP). The issue with Apache is that it had limits, and compared to NGINX, was in fact much slower.
Virtualmin and Webmin do not actually use MySQL for their core operation - they don’t even use Apache or NGINX for the core web services, which is why the admin port is set to a default of 10000 when you first complete the setup.
Essentially, you can think of Virtualmin and Webmin as a central pane of glass to manage the underlying components that are required to run a website. MySQL doesn’t need to be installed if you are not actually using it, but is there as PHP typically is paired with either MySQL or MariaDB, so it makes sense to offer the installation of this itself, as well as support for managing it.
Did this solution help you?
Hello! It looks like you're interested in this conversation, but you don't have an account yet.
Getting fed up of having to scroll through the same posts each visit? When you register for an account, you'll always come back to exactly where you were before, and choose to be notified of new replies (ether email, or push notification). You'll also be able to save bookmarks, use reactions, and upvote to show your appreciation to other community members.
With your input, this post could be even better 💗
RegisterLog in
